Platform Products
8 Operational Pillars.
One Unified Platform.

Each pillar is purpose-built for its domain. Every pillar feeds Sentinel AI - the intelligence layer that connects, correlates, and acts across all of them.

ServiceOps
ClusterOps
Sherlock
SecurityOps
DataOps
FinOps
ProcBot
BusinessOps
Application Observability
ServiceOps
Every service, every trace, every answer.
Powered by Sentinel →
🔗

Distributed Tracing & Service Topology

Visualize every hop in your request chain - from API gateway to database query. ServiceOps reconstructs the full call graph from trace data, showing per-service latency, error rates, and dependency health in real time.

📋

Cross-Service Log Correlation

Logs from 12 services, correlated in milliseconds. When checkout fails, ServiceOps instantly shows which upstream service triggered the cascade - with timestamps and error context aligned across the full chain.

Database Query Performance Monitoring

Identify slow queries, full table scans, and missing indexes - before they degrade user experience. ServiceOps tracks query execution time at the span level and links database bottlenecks to the services that trigger them.

📊

SLA & Error Rate Dashboards

P50, P95, P99 latency tracking. Error rate trending by service, endpoint, and deployment. Real-time alerting when SLOs are at risk - before the SLA is breached.

ServiceOps - Live Topology
Checkout Flow - P95 Latency Breakdown
API Gateway
2ms
checkout-service
15ms
order-service
45ms
inventory-service
80ms
pricing-service
4,800ms ⚠
pricing_db
4,750ms (full table scan)
5.1s
P95 Latency
94%
In pricing-svc
Root Cause
Missing index
94%
Faster root cause identification
5
Service hops traced automatically
4→1
Tools replaced by ServiceOps
Real-time
Cross-service log correlation
Container Orchestration Operations
ClusterOps
Container orchestration at enterprise scale, minus the complexity.
Powered by Sentinel →
🏥

Cluster Health & Resource Intelligence

Node capacity, pod scheduling pressure, resource quota utilization - all in one view. ClusterOps identifies overprovisioned namespaces, underutilized nodes, and capacity risks before they cause CrashLoops.

💥

CrashLoop & OOMKill Analysis

When a pod crashes at 2 AM, Sentinel uses ClusterOps to autonomously inspect the failing pod - identifying OOMKilled events, exit codes, and error patterns from logs and events without waking an engineer.

🔧

Cluster Management Automation via Sentinel

Sentinel executes cluster management commands as part of autonomous investigations. Engineers can also trigger cluster management through Copilot in plain English - no syntax required. Results returned in structured, readable format.

🌐

Network Policy & Ingress Visibility

Full visibility into network policies, ingress rules, and service mesh configuration. Critical for security - ClusterOps is what enables Sentinel to isolate a compromised server's SSH access in 90 seconds.

ClusterOps - Pod Events
02:47:12
CrashLoopBackOff - payment-service-7d4f8b9 · Reason: OOMKilled
02:47:17
Sentinel initiated investigation · automated pod diagnostics running
02:47:22
Exit Code: 137 · Memory limit exceeded · Container OOMKilled
02:47:31
automated pod diagnostics executed · OutOfMemoryError: Java heap space at 02:40 AM
02:53:04
RCA Delivered · Memory limit insufficient · Recommendation: 2GB
6 min
MTTR
Zero
Engineers paged
5
Data sources checked
58→6 min
MTTR for pod incidents
Zero
Engineers woken for L1 issues
100%
Incidents with full audit trail
Auto
cluster diagnostic command execution by Sentinel
RCA Close-Loop Engine · Optimize
Sherlock
Every fix proven real. Every RCA loop closed. Resolutions that last.
Sentinel's Optimization Engine →

Continuous Post-Fix Validation

After every autonomous resolution or engineer-applied fix, Sherlock monitors the resolved signals for a configurable window. If the anomaly resurfaces - alert volume, error rate, security event - the incident is automatically reopened with a "recurrence detected" flag before it becomes an outage again.

🔁

Recurrence Detection & Root Cause Escalation

Sherlock tracks incident patterns across time. When the same root cause appears three or more times, it flags the issue as "band-aid resolved" and escalates to L2 for a permanent fix - with the full pattern history as evidence. Repeated firefighting stops.

📊

MOP Effectiveness Scoring

Every ProcBot MOP execution is scored by Sherlock: did the procedure close the incident? Did it recur? How fast? Over time, Sherlock surfaces the MOPs that work and flags the ones that don't - giving your team a continuously improving runbook library without manual audit.

🧬

RCA Validation Engine

Sherlock compares the stated root cause in the closed RCA against actual service telemetry post-resolution. If the service behaviour diverges from the expected stable state, Sherlock challenges the RCA and triggers a re-investigation - ensuring Sentinel's analysis is empirically correct, not just plausible.

Sherlock - Fix Validation & Loop Closure
payments-svc · Post-Resolution Monitoring
IncidentINC-4821 · Memory Leak · Resolved
Fix AppliedPod restart + MOP-12 executed
Validation Window24h monitoring active
Signal StatusStable · 6h post-fix
Recurrence CheckNo recurrence detected
MOP-12 ScoreEffective · +1 confidence
Sherlock: INC-4821 confirmed closed. Root cause validated - memory leak traced to uncleaned connection pool. MOP-12 effectiveness score updated to 94%. Loop closed.
24h
Default post-fix validation window
Zero
False closures - every fix validated
Auto
MOP scoring & continuous improvement
Recurrence triggers permanent fix path
SIEM & Extended Detection
SecurityOps
Detect. Contain. Comply. Every threat, every regulation.
Powered by Sentinel →

SIEM-powered Threat Detection & XDR

Enterprise-grade SIEM with built-in log analysis, file integrity monitoring, vulnerability detection, active response, and container security - built on proven open-source intelligence foundations with a modern React UI surfaced through Sentinel.

🗺

MITRE ATT&CK Threat Mapping

Every alert mapped to the MITRE ATT&CK framework. Understand not just what happened, but the technique, tactic, and kill chain stage - giving security analysts immediate context for prioritization.

📞

Proactive User Verification (Sentinel Voice)

Unusual login from a new country? SSH brute force on a production server? Sentinel doesn't wait for an analyst - it calls the affected user or VM owner directly, confirms the threat, and acts in seconds.

📑

Multi-Framework Compliance Automation

PCI-DSS, HIPAA, SOC 2, ISO 27001, GDPR - out-of-the-box compliance rules. Sentinel generates audit evidence packages automatically. SOC 2 evidence collection: from 3 weeks to 30 minutes.

SecurityOps - Threat Timeline
09:12
Brute Force Detected - 5 failed SSH attempts from 185.220.101.43 (Tor exit node)
09:12
MITRE ATT&CK: T1110.001 - Brute Force: Password Guessing
09:13
Correlation: same IP targeted 3 other servers this hour
09:13
Sentinel called VM owner Sarah Chen · "Isolate from public access?"
09:14
Confirmed YES · Firewall rule applied · SSH locked to bastion only
90s
Detection → Isolation
4
Servers protected
Zero
Analyst needed
90s
SSH threat containment
60s
Login threat response
5
Compliance frameworks covered
30min
SOC 2 evidence generation
Data Pipeline Intelligence
DataOps
Your data pipelines, always healthy. Issues caught before downstream impact.
Powered by Sentinel →

Pipeline Job Health & Failure Detection

Monitor ETL and ELT job completion, failure rates, and execution duration in real time. When a nightly data load fails at 02:00 AM, Sentinel identifies the cause - network timeout, schema drift, or upstream dependency - before anyone arrives in the morning.

📉

Data Quality Drift Detection

Track null rates, value distributions, and row count anomalies across datasets. DataOps detects when a source system starts sending malformed records - before those records corrupt downstream analytics or machine learning models.

🚦

Ingestion Lag & Throughput Monitoring

Real-time tracking of ingestion lag for streaming and batch pipelines. Sentinel alerts when Kafka consumer lag exceeds thresholds, when batch windows are at risk, or when throughput drops below SLA.

🔄

Dependency & Lineage Awareness

DataOps maps pipeline dependencies - which downstream dashboards, reports, and ML models rely on each dataset. Sentinel uses this lineage to calculate the blast radius of a pipeline failure before notifying the right teams.

DataOps - Pipeline Health
Pipeline Status - Last 24 Hours
sales_daily_etl
Completed
2m 14s
customer_sync
Completed
8m 44s
analytics_load
FAILED
Schema drift
ml_feature_pipe
Running (lag)
+18 min lag
reporting_batch
Completed
4m 02s
Sentinel alert: analytics_load failed - null rate in order_id column jumped from 0.1% to 34%. 3 downstream reports affected.
Real-time
Pipeline failure detection
Before
Issues caught before downstream impact
Full
Lineage-aware blast radius assessment
Auto
Root cause & team notification
Cloud Cost Intelligence
FinOps
Spend less. Know more. Optimize before the invoice arrives.
Powered by Sentinel →
📊

Real-Time Cloud Spend Monitoring

Track cloud spend across AWS, GCP, and Azure in real time - by team, service, environment, and resource type. No more surprise bills. FinOps surfaces spend trends daily so finance and engineering stay aligned.

🚨

Cost Anomaly Detection

Sentinel detects abnormal spend patterns before they compound. A forgotten load test running for 6 hours, an autoscale event that never scaled back down, a debug log level pumping data into S3 at 100x normal rate - caught in hours, not at month-end.

Rightsizing Recommendations

FinOps analyzes CPU, memory, and I/O utilization patterns to identify overprovisioned resources. Sentinel generates rightsizing recommendations with estimated savings - cross-referenced with ClusterOps to ensure capacity safety before downsizing. Every rightsizing action is then validated by Sherlock: confirming performance held and the savings persisted over a 24-hour window.

🏷

Showback & Chargeback Reporting

Allocate cloud costs to teams, products, and clients with tag-based showback reports. For professional services firms managing multi-tenant platforms, FinOps provides per-client cost visibility that maps directly to engagement billing.

FinOps - Spend Anomaly
Top Cost Drivers This Week
compute (EC2)
Normal
+2%
data transfer
ANOMALY ⚠
+847%
storage (S3)
Elevated
+94%
database (RDS)
Normal
-3%
Sentinel alert: analytics-service LOG_LEVEL=DEBUG (set in v2.8 deployment) is generating 100x normal log volume. S3 data transfer cost on track to exceed monthly budget by end of week.
Hours
Anomaly detection (vs. month-end)
Cross
-correlated with ClusterOps & ServiceOps
Per
-client cost visibility for multi-tenant
Auto
Rightsizing with capacity safety check
Act · Scalable Procedure Execution
ProcBot
Every MOP stored, versioned, and executed at scale. Ansible-native. Zero-touch.
Sentinel's Execution Engine →
🗂

Unified MOP Library - Investigation & Execution

ProcBot is the single source of truth for all procedures. Investigation MOPs guide Sentinel's diagnostic reasoning when facing unknown failures. Execution MOPs are the step-by-step remediation scripts Sentinel runs to fix them. Both types stored, versioned, and continuously improved by Sherlock.

Ansible + Shell/Bash Execution Engine

ProcBot natively executes Ansible playbooks and shell/bash scripts - your existing automation library, unchanged. Bring your current runbooks: ProcBot wraps them with observability, audit logging, conditional branching, and rollback logic. Nothing rewritten, everything enhanced.

Human-in-the-Loop Approvals

For high-impact procedures, ProcBot triggers a human approval step. Sentinel presents the procedure, the evidence, and the risk assessment - and waits for confirmation before executing. Approval, action, and evidence are all audit-logged for compliance.

📁

Escalation & Conditional Branching

Procedures aren't linear scripts - they're intelligent workflows. ProcBot supports conditional branching (if disk > 90% and service is critical, execute escalation path), timeout-based fallback, and multi-step approval chains. Every edge case handled, every action logged.

ProcBot - MOP Execution Engine
03:14
Alert: /data volume at 92% on analytics-prod-01 · 4 hours to full
03:14
ProcBot: Execution MOP-07 loaded · Disk Cleanup Procedure · Ansible playbook ready
03:15
Step 1 ✓ - compress_logs.yml · Freed 140GB · Volume now at 24%
03:15
Investigation MOP-03 triggered · Root cause path: LOG_LEVEL=DEBUG set 3 days ago
03:16
Fix applied · Developer notified · Sherlock validation window opened (24h)
3 min
Full resolution
Zero
Human involvement
MOP-07
Ansible-native execution
MOP Execution Flow - From Detection to Validated Resolution
How ProcBot Executes a MOP  -  from Sentinel detection to validated resolution

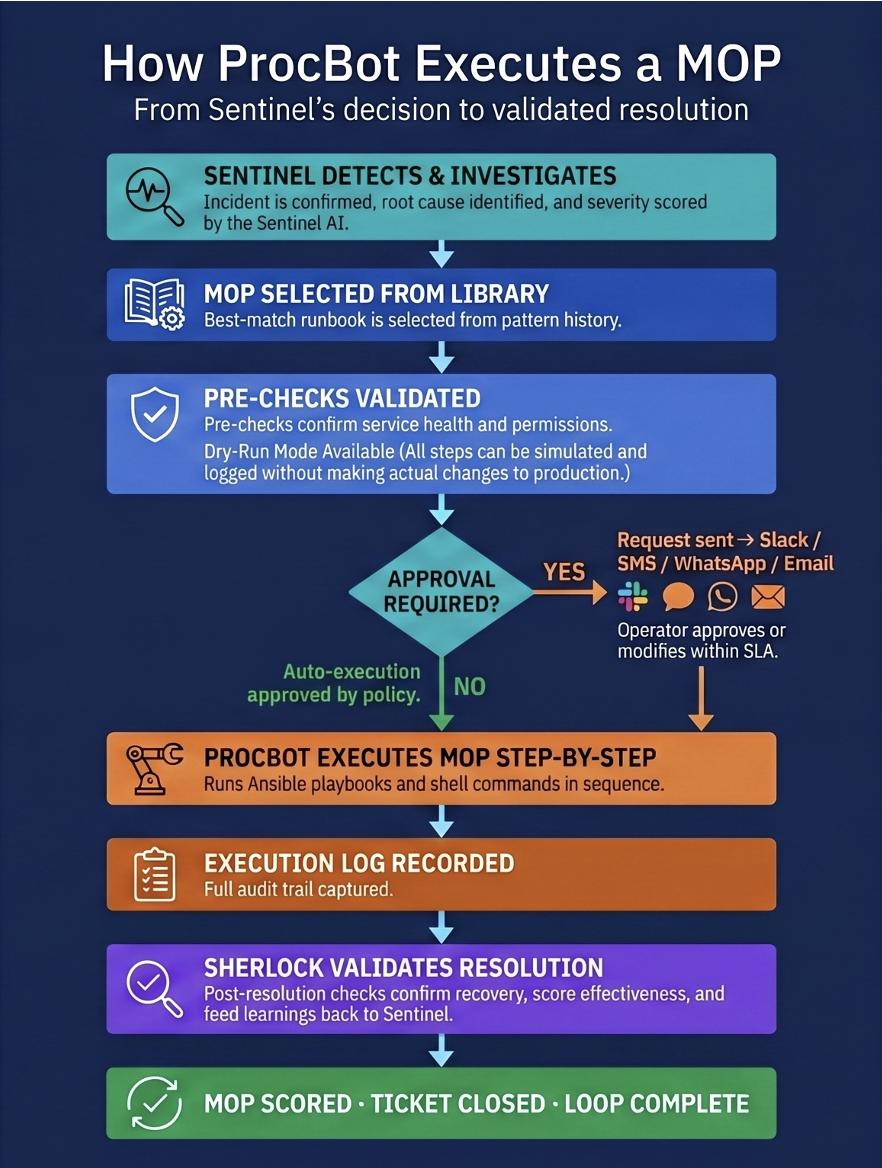
Every MOP step is logged, auditable, and scored by Sherlock - creating a continuously improving, self-optimising procedure library.

45→3min
Alert-to-resolution time
80%
Common alerts auto-resolved
Ansible
Native + Shell/Bash execution
Full
Audit log for every action taken
Business Process Intelligence
BusinessOps
Operations that understand your business, not just your infrastructure.
Powered by Sentinel →
📋

MOP - Method of Procedure Framework

Encode your organization's tribal knowledge as structured procedures. RBAC debugging, client onboarding, login failure investigation, user provisioning - any business process can be turned into a MOP that Sentinel follows, giving every L1 agent the power of your best L2 expert.

🔐

RBAC & Access Debugging

BusinessOps connects directly to your identity provider to debug permission issues. When a user can't see a module, Sentinel queries the permission model, compares with a working reference user, and identifies the exact missing groups - in 90 seconds, no L2 needed.

🚀

Onboarding & Provisioning Validation

New client engagement or system onboarding? BusinessOps validates every provisioning step against a MOP - identity provider realm setup, module access, SIEM rules, network policies. Misconfigurations identified before the client arrives.

🤝

Support Ticket Automation

The most common support tickets - "can't log in," "can't see this module," "how do I get access to X" - automated end-to-end. Sentinel investigates via MOP, delivers the diagnosis, and closes the ticket. L1 throughput multiplied without headcount.

BusinessOps - RBAC MOP Execution
L1 Support · Copilot Chat
"User john.doe@acme.com cannot see the GIS module."
Step 1
MOP loaded: RBAC Feature Access Debugging
Step 2
Identity provider query: user is in [Platform-Users, Analytics-Viewer, Dashboard-Access]
Step 3
Knowledge base: GIS requires GIS-Viewer + GIS-Data-Access groups
Step 4
Reference user sarah.smith has both groups. john.doe has neither.
Done
Add GIS-Viewer + GIS-Data-Access groups in identity provider. Confirmed by 6× 403 Forbidden logs.
✓ Resolved in 90 seconds · Zero L2 escalation
90s
RBAC issue resolution
85%
L2 access ticket deflection
Any
Business process can be automated via MOP
Zero
Tribal knowledge required by L1